> ## Documentation Index
> Fetch the complete documentation index at: https://api.superseeded.ai/docs/llms.txt
> Use this file to discover all available pages before exploring further.
# Species Distribution Modeling
> Generate species distribution models and climate suitability maps for any species
## Overview
The SDM (Species Distribution Modeling) endpoints generate predictive models showing where species can survive under current and future climate conditions. The API uses MaxEnt modeling with CHELSA climate data to produce distribution maps.
## Generate SDM
Scientific name of the species to model (e.g., "Eucalyptus regnans")
Species names are automatically validated and corrected using TNRS (Taxonomic Name Resolution Service) before processing. Capitalization errors and minor misspellings are automatically corrected.
Global Climate Model to use for projections
Available models:
* `mpi-esm1-2-hr`
* `ukesm1-0-ll`
* `ipsl-cm6a-lr`
* `miroc6`
* `ec-earth3`
Emission scenario for future projections
Options:
* `ssp126` - Very low emissions
* `ssp245` - Intermediate emissions
* `ssp370` - High emissions
* `ssp585` - Very high emissions
Future time period for projections
Options:
* `2030` - Near future (2011-2040)
* `2050` - Mid-century (2041-2070)
* `2070` - Late century (2071-2100)
Suitability threshold for classification (0.0 to 1.0)
Values above this threshold are considered suitable habitat
Whether to generate gradient suitability maps and trajectory streamplot
Generates:
* Current climate suitability gradient
* Future climate suitability gradient
* Stability trajectory streamplot showing habitat shifts
Whether to cache downloaded climate data files for faster subsequent requests
## Response
Unique identifier for the SDM generation job
Current status of the job (`queued`, `processing`, `completed`, `failed`)
Human-readable status message
URL to check job status and retrieve results
```bash cURL theme={"theme":"github-dark"}
curl -X POST 'https://api.superseeded.ai/v1/sdm/generate' \
-H 'X-API-Key: YOUR_API_KEY' \
-H 'Content-Type: application/json' \
-d '{
"species_name": "Eucalyptus regnans",
"gcm": "mpi-esm1-2-hr",
"scenario": "ssp585",
"period": "2070",
"include_gradient_maps": true
}'
```
```javascript Node.js theme={"theme":"github-dark"}
const response = await fetch('https://api.superseeded.ai/v1/sdm/generate', {
method: 'POST',
headers: {
'X-API-Key': 'YOUR_API_KEY',
'Content-Type': 'application/json',
},
body: JSON.stringify({
species_name: 'Eucalyptus regnans',
gcm: 'mpi-esm1-2-hr',
scenario: 'ssp585',
period: '2070',
include_gradient_maps: true
})
});
const data = await response.json();
console.log('Job ID:', data.job_id);
```
```python Python theme={"theme":"github-dark"}
import requests
response = requests.post(
'https://api.superseeded.ai/v1/sdm/generate',
headers={
'X-API-Key': 'YOUR_API_KEY',
'Content-Type': 'application/json'
},
json={
'species_name': 'Eucalyptus regnans',
'gcm': 'mpi-esm1-2-hr',
'scenario': 'ssp585',
'period': '2070',
'include_gradient_maps': True
}
)
data = response.json()
print(f"Job ID: {data['job_id']}")
```
```json theme={"theme":"github-dark"}
{
"job_id": "7fb88dc37627701681adae8932f85132",
"status": "queued",
"message": "Job 7fb88dc37627701681adae8932f85132 has been queued for processing",
"status_url": "/v1/sdm/status/7fb88dc37627701681adae8932f85132"
}
```
***
## Check job status
SDM generation typically takes 2-4 minutes to complete depending on the species and data availability.
```http theme={"theme":"github-dark"}
GET /v1/sdm/status/{job_id}
```
### Response fields
The job identifier
Current job status (`queued`, `processing`, `completed`, `failed`)
File paths for generated outputs (when completed)
Download URLs for visualization files (when completed)
Available plots:
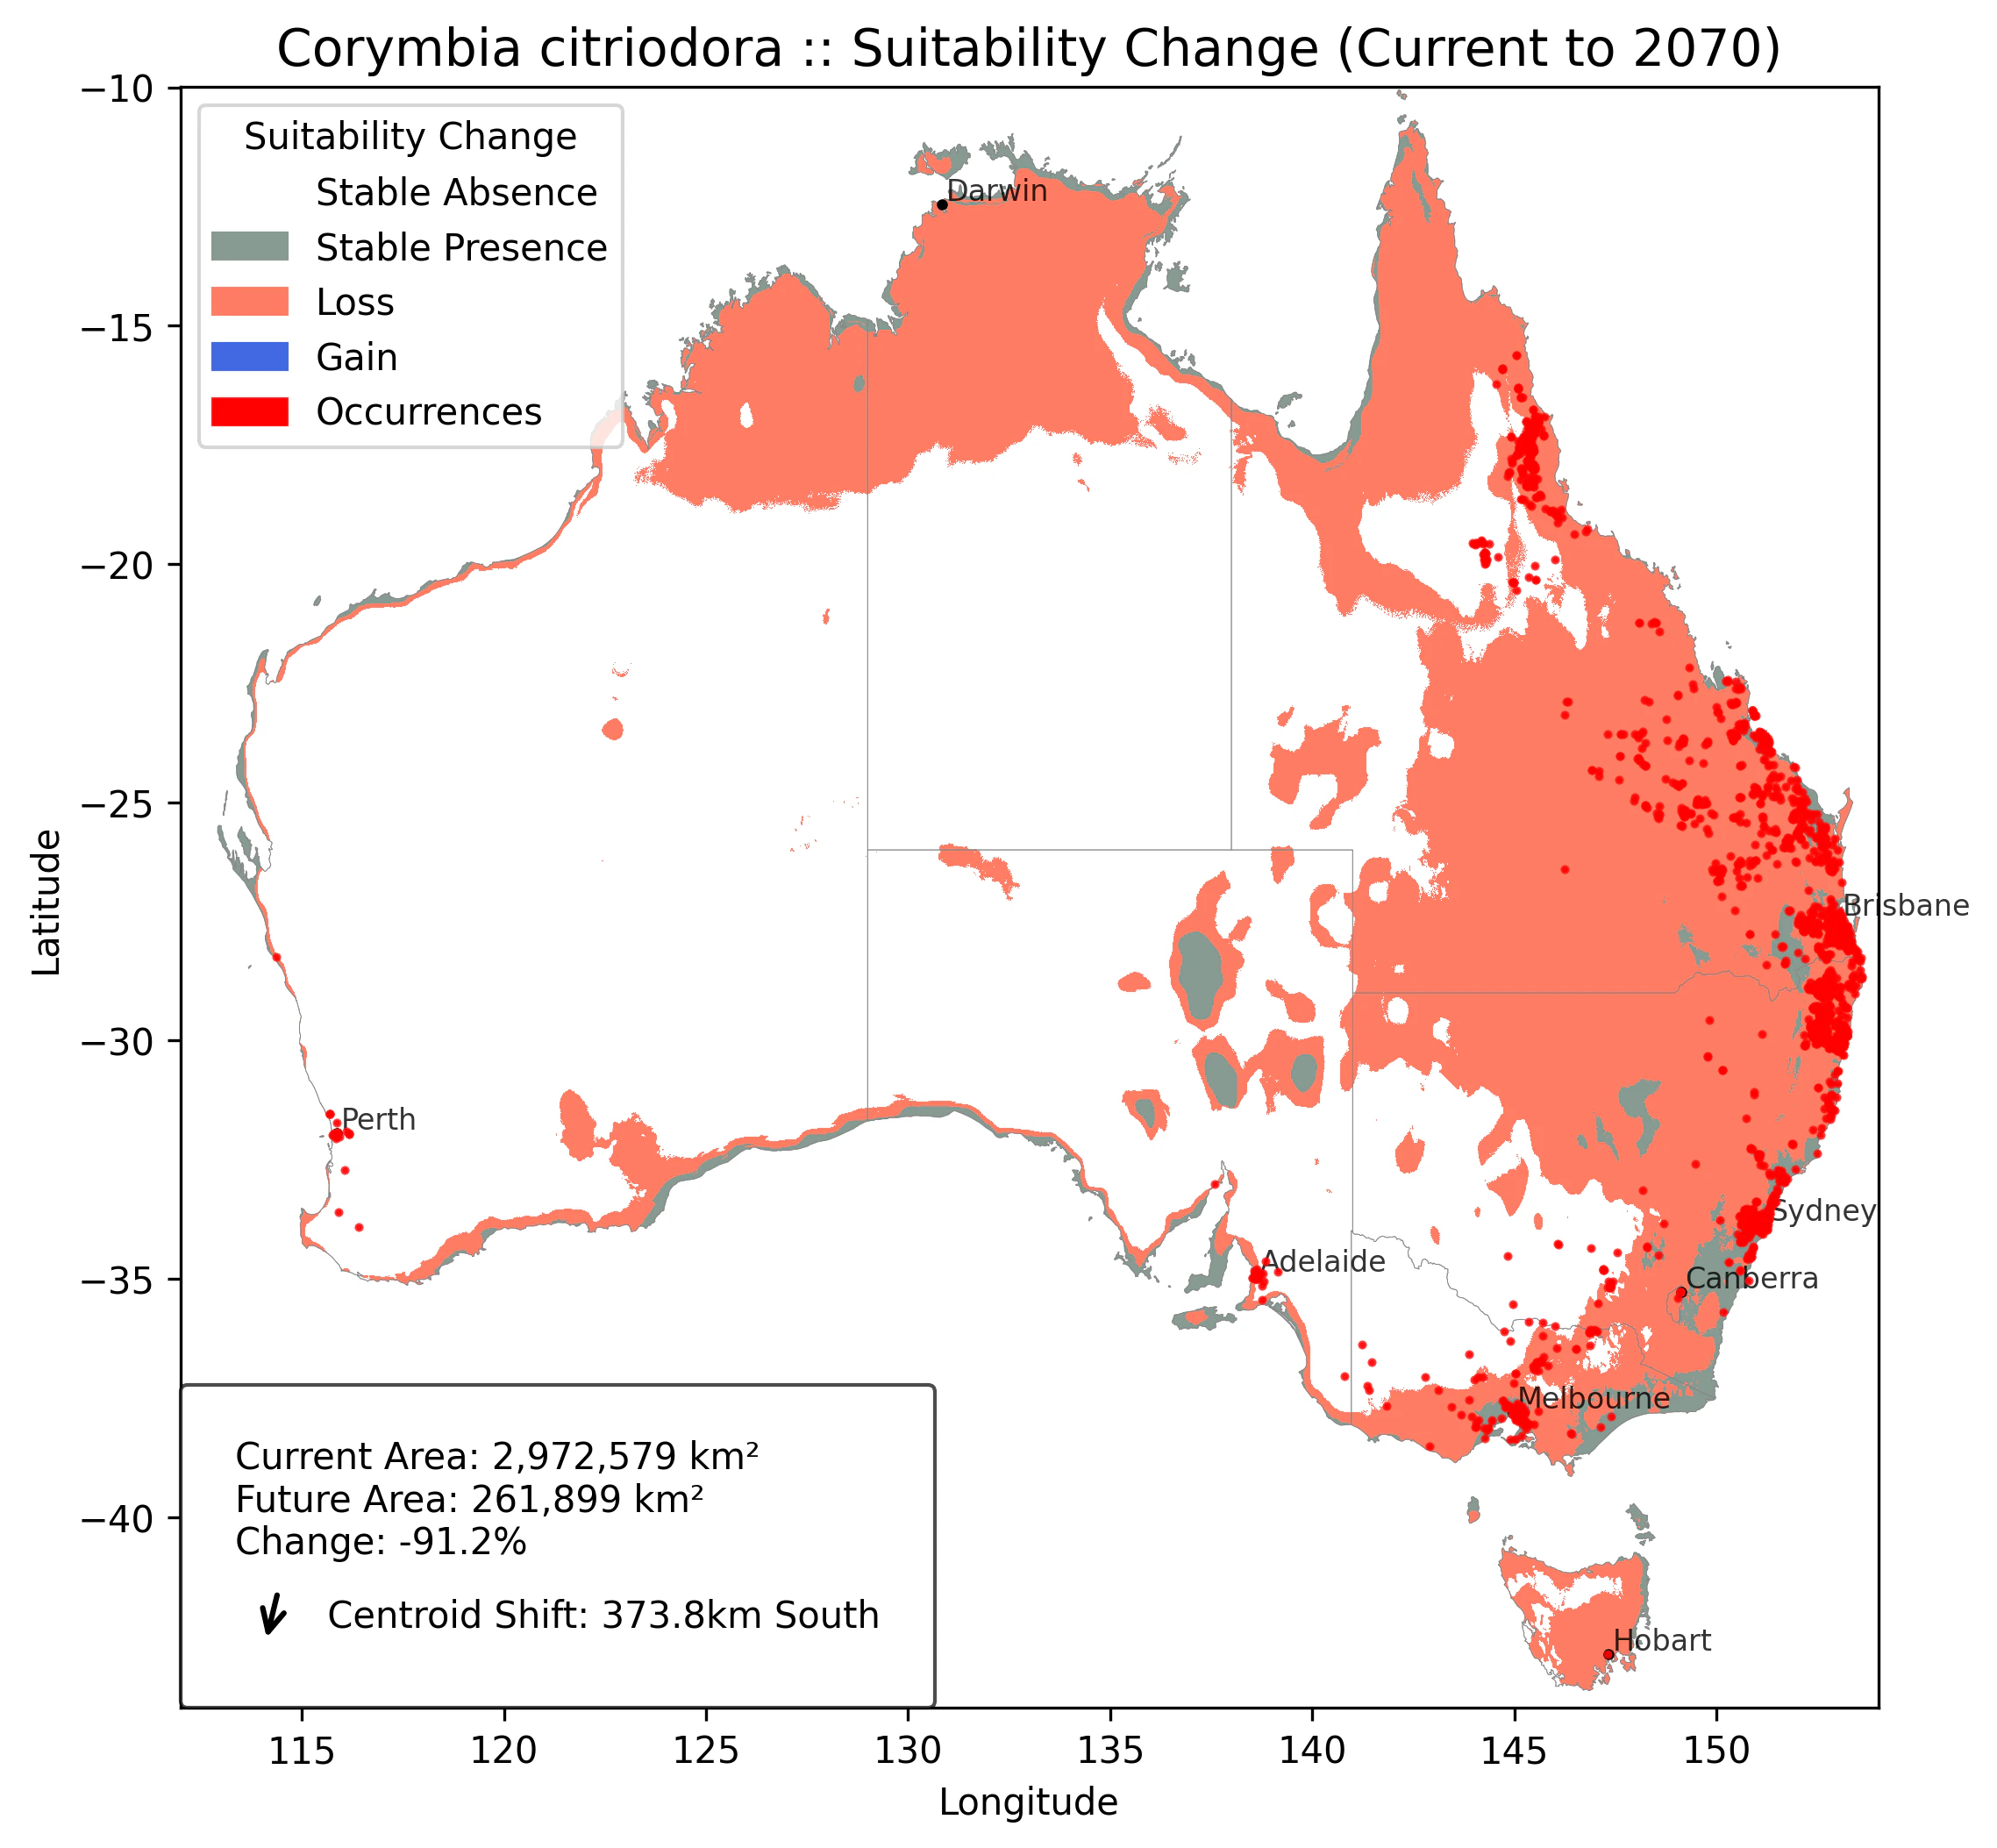
* `change_plot` - Suitability change map
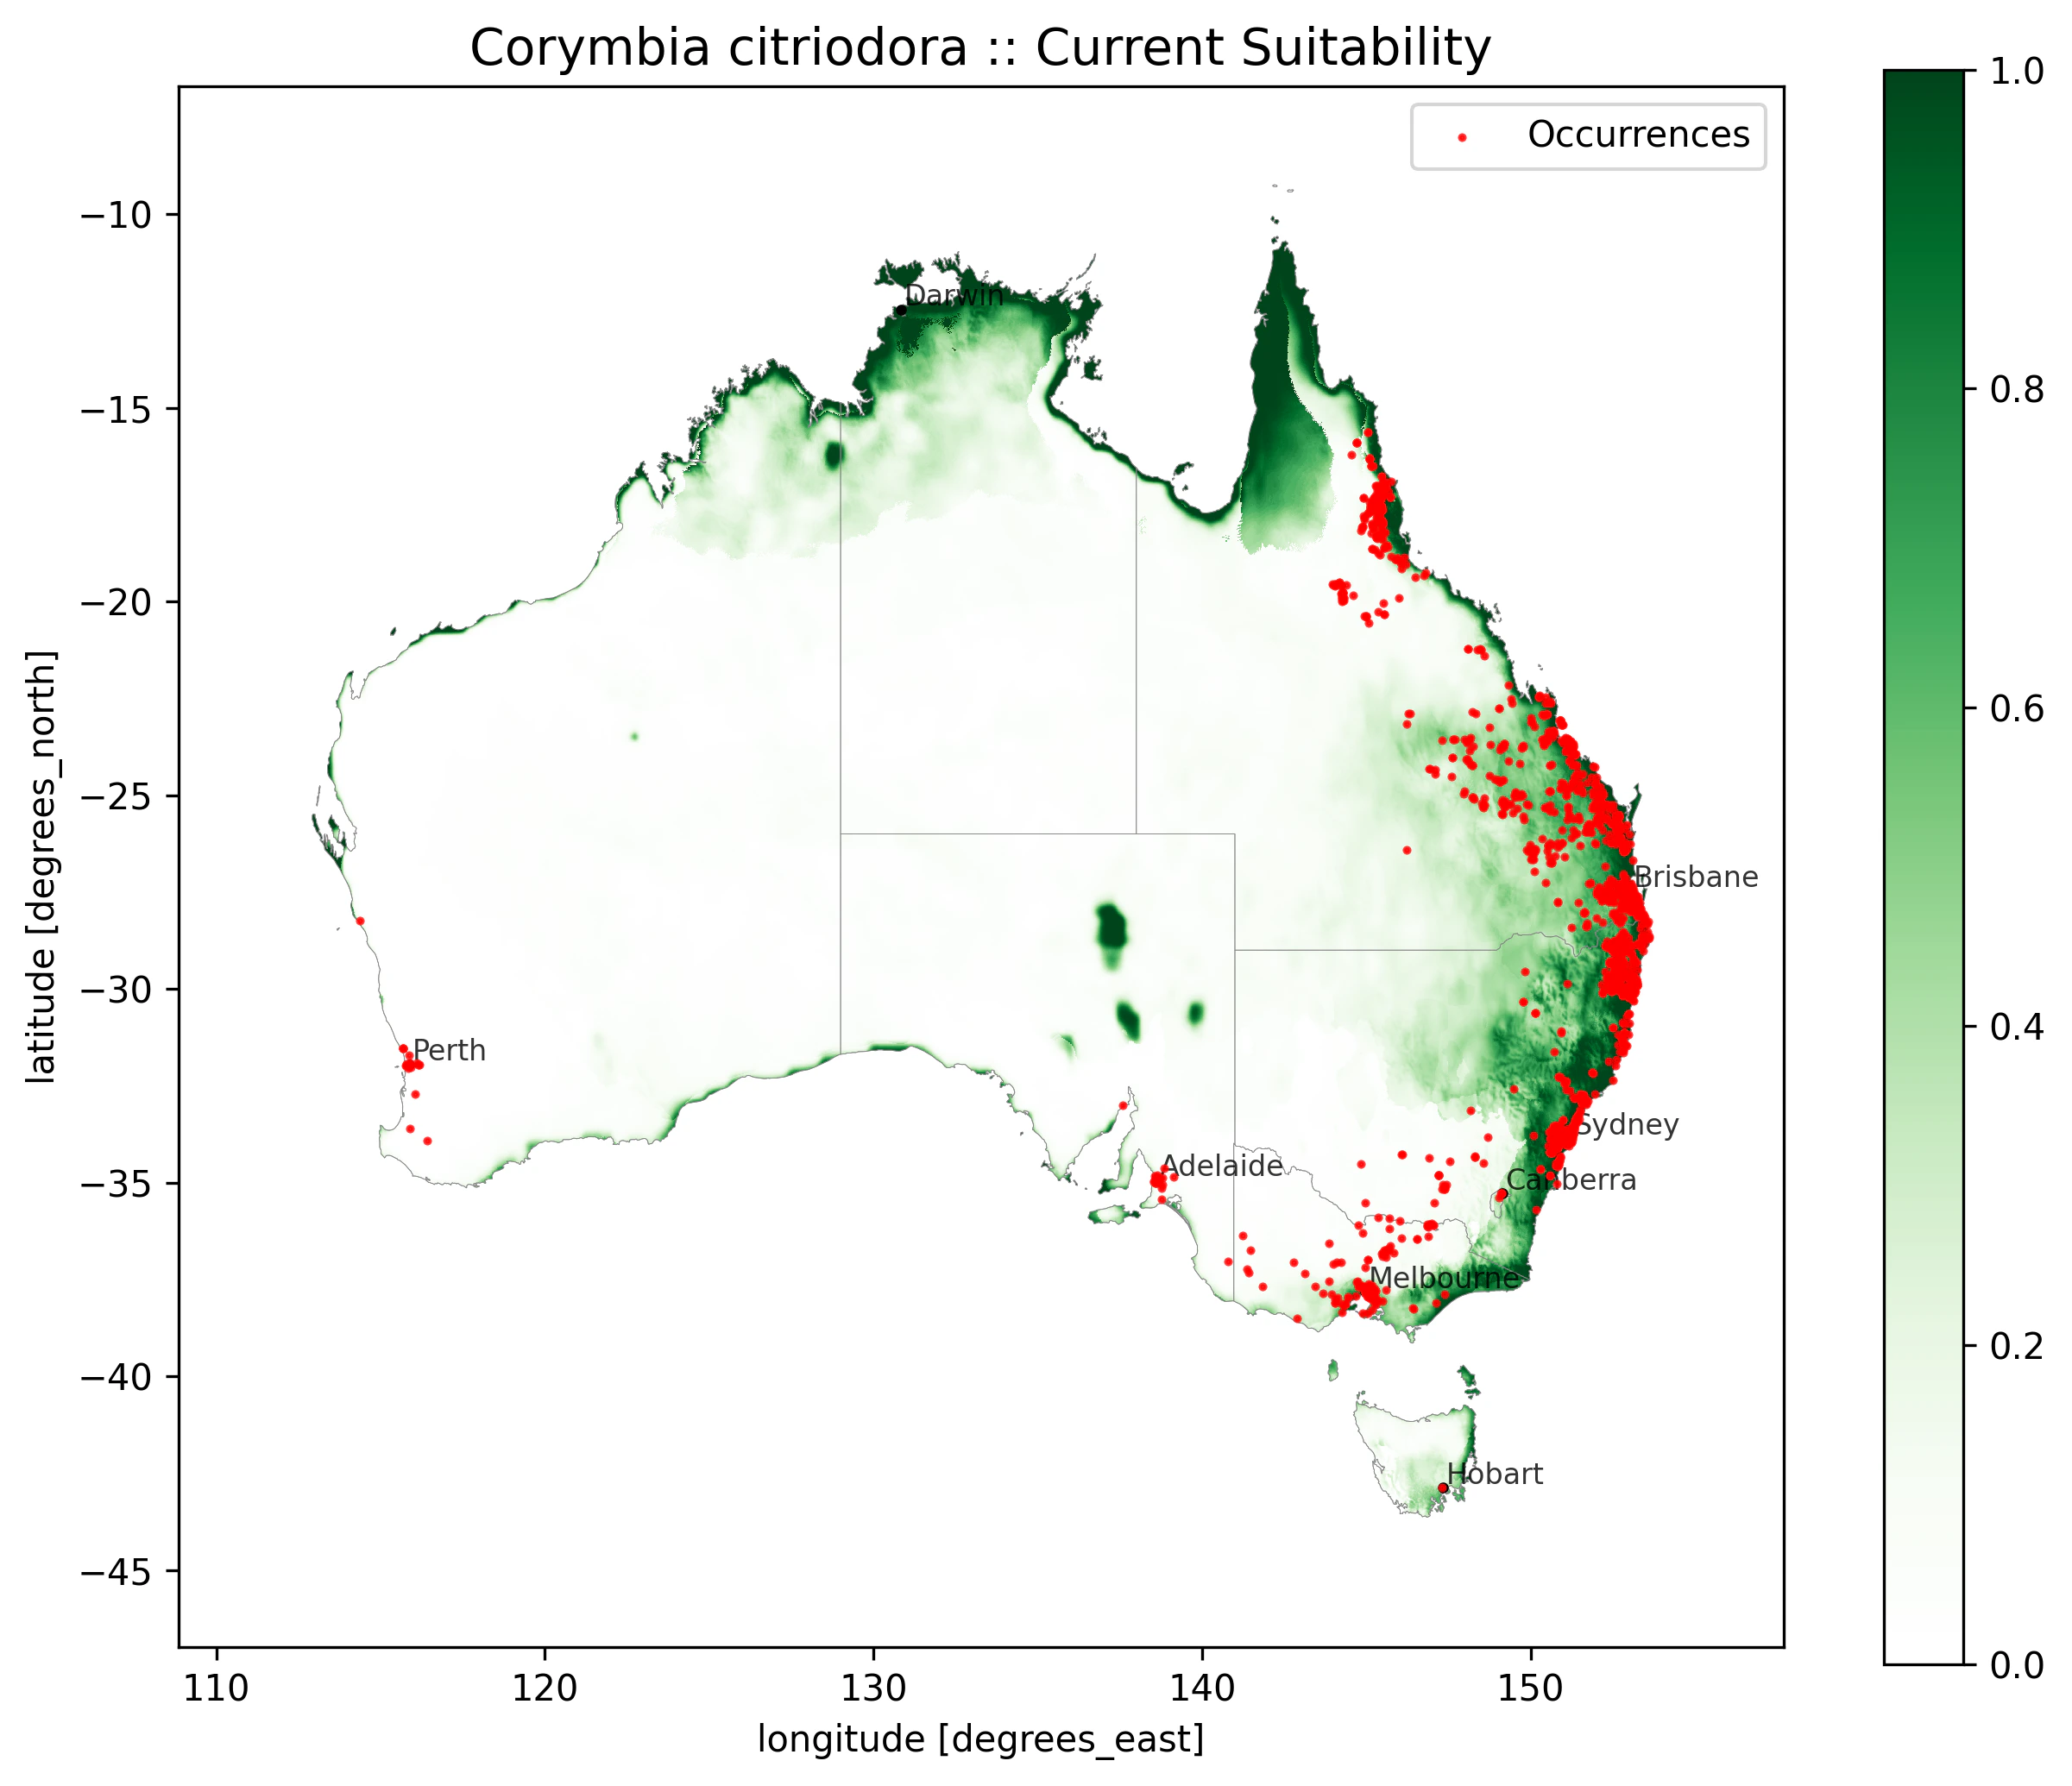
* `current_gradient` - Current climate suitability
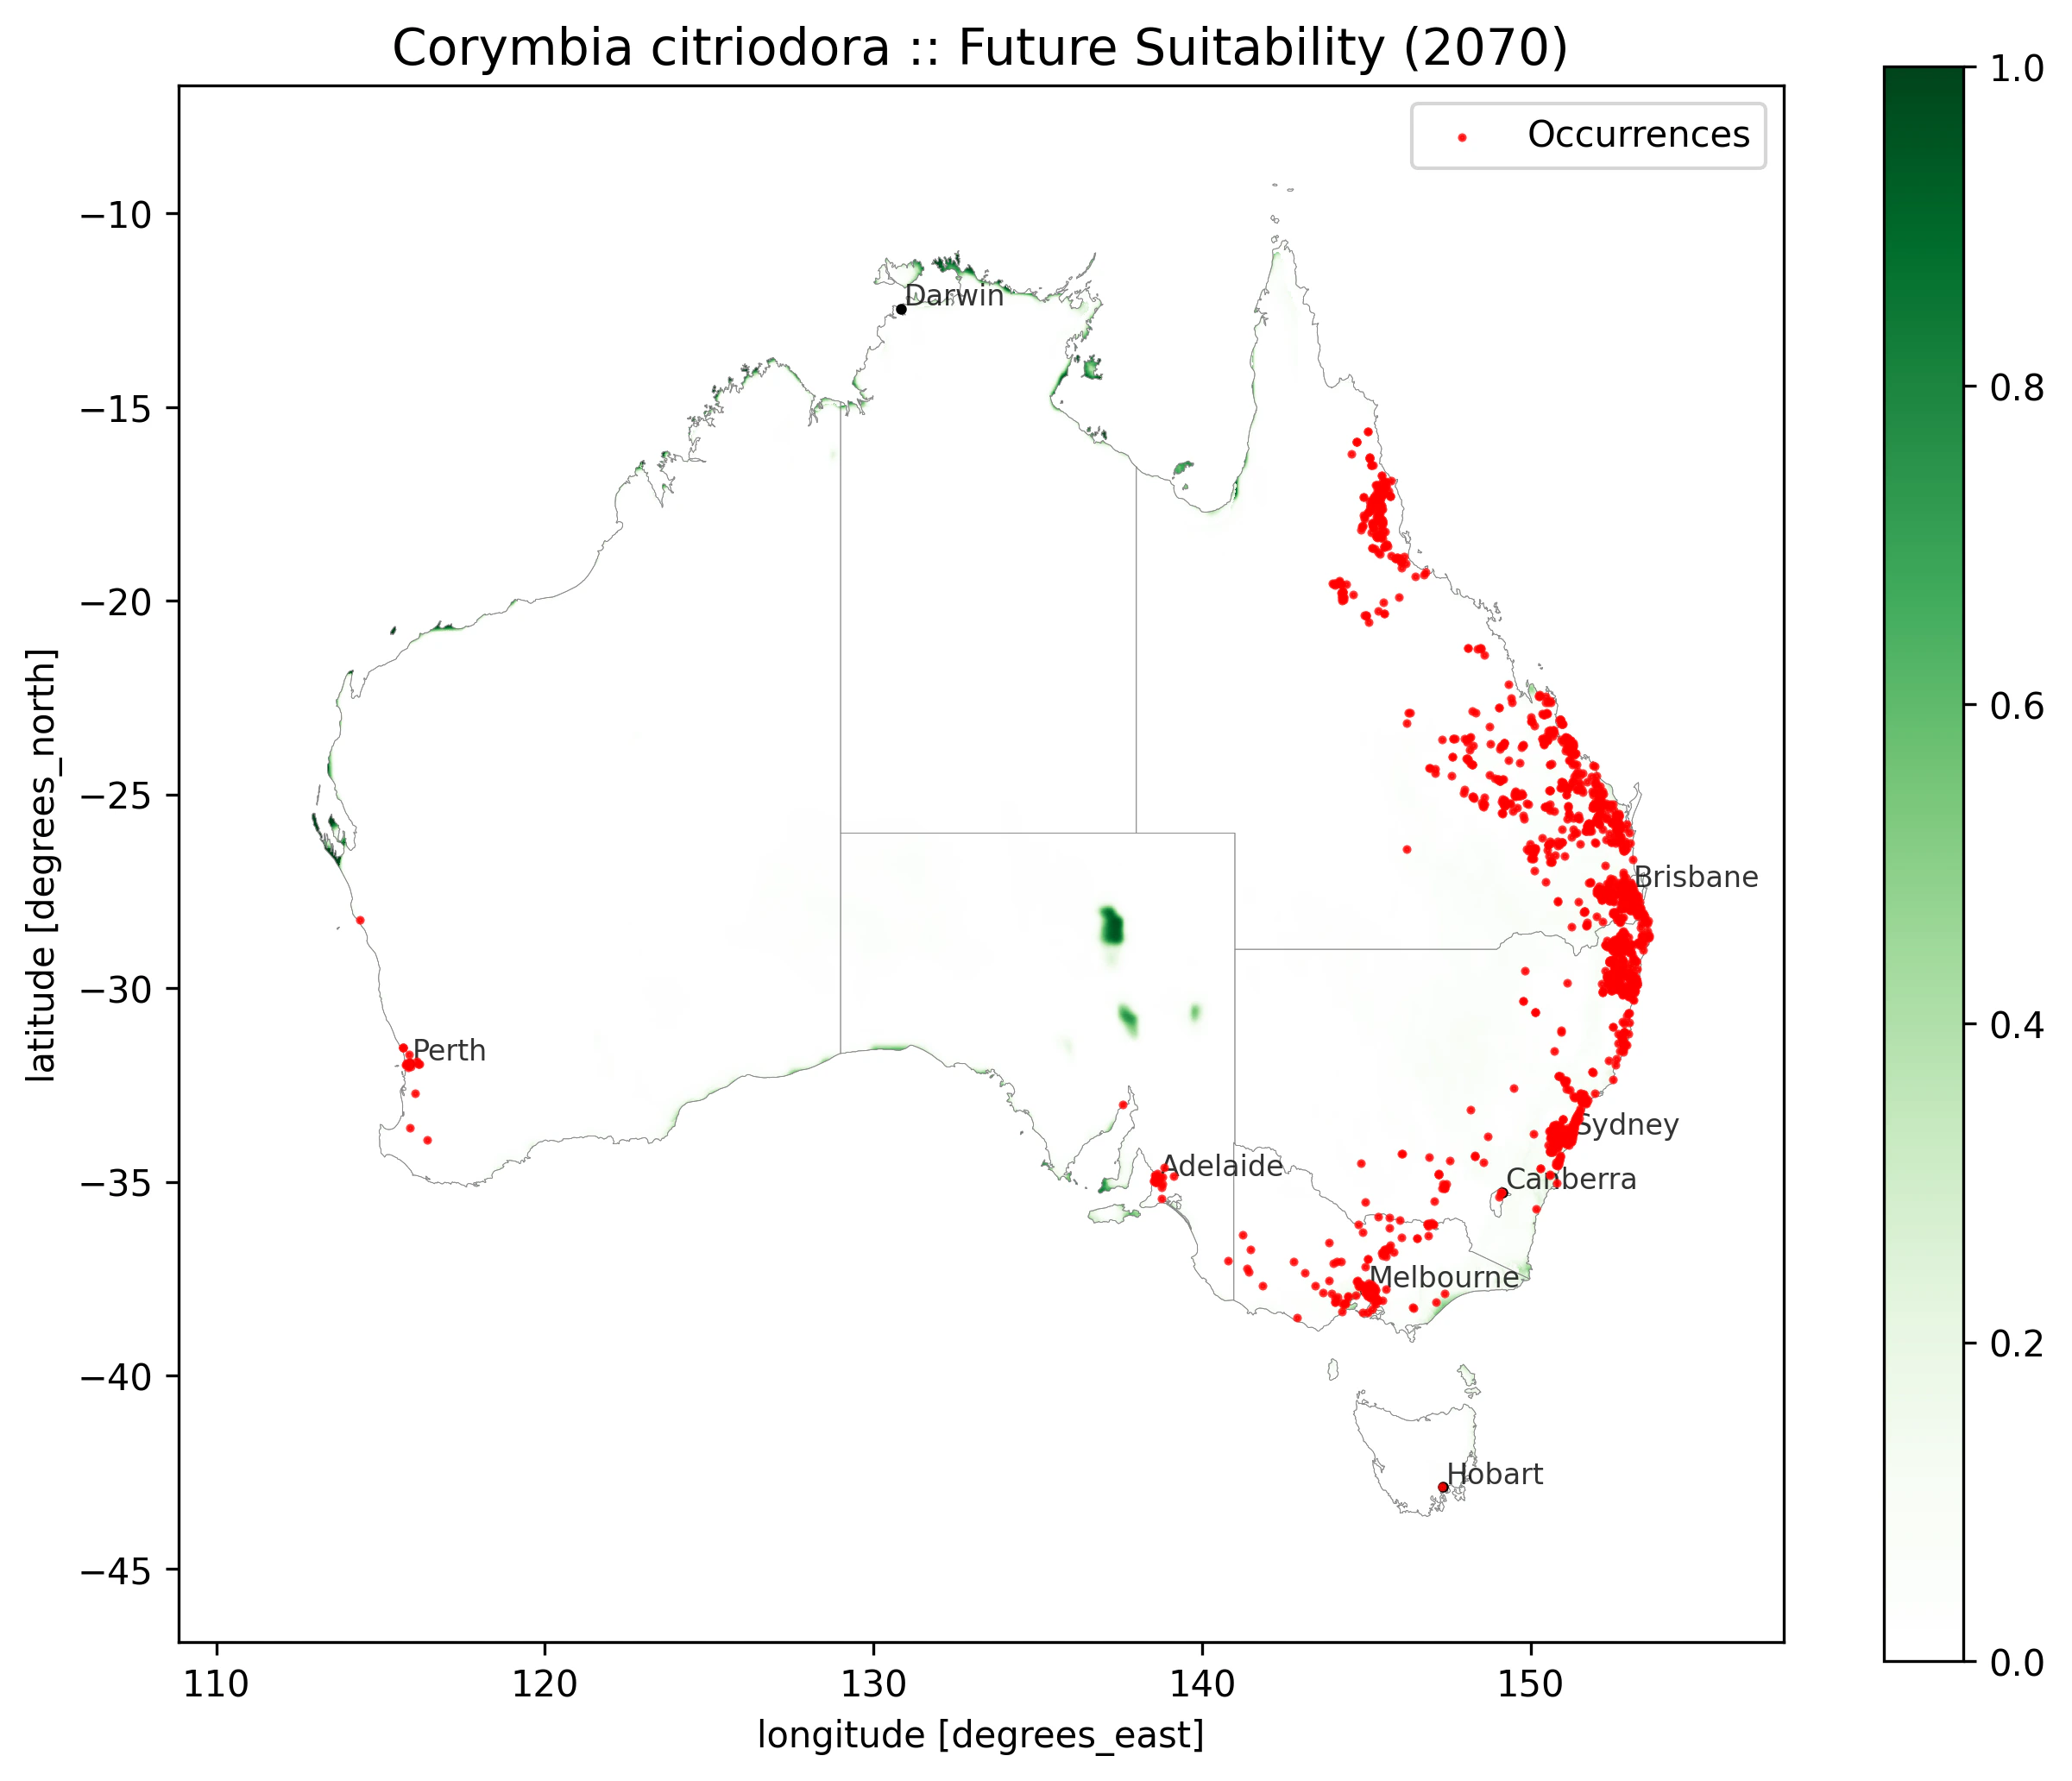
* `future_gradient` - Future climate suitability
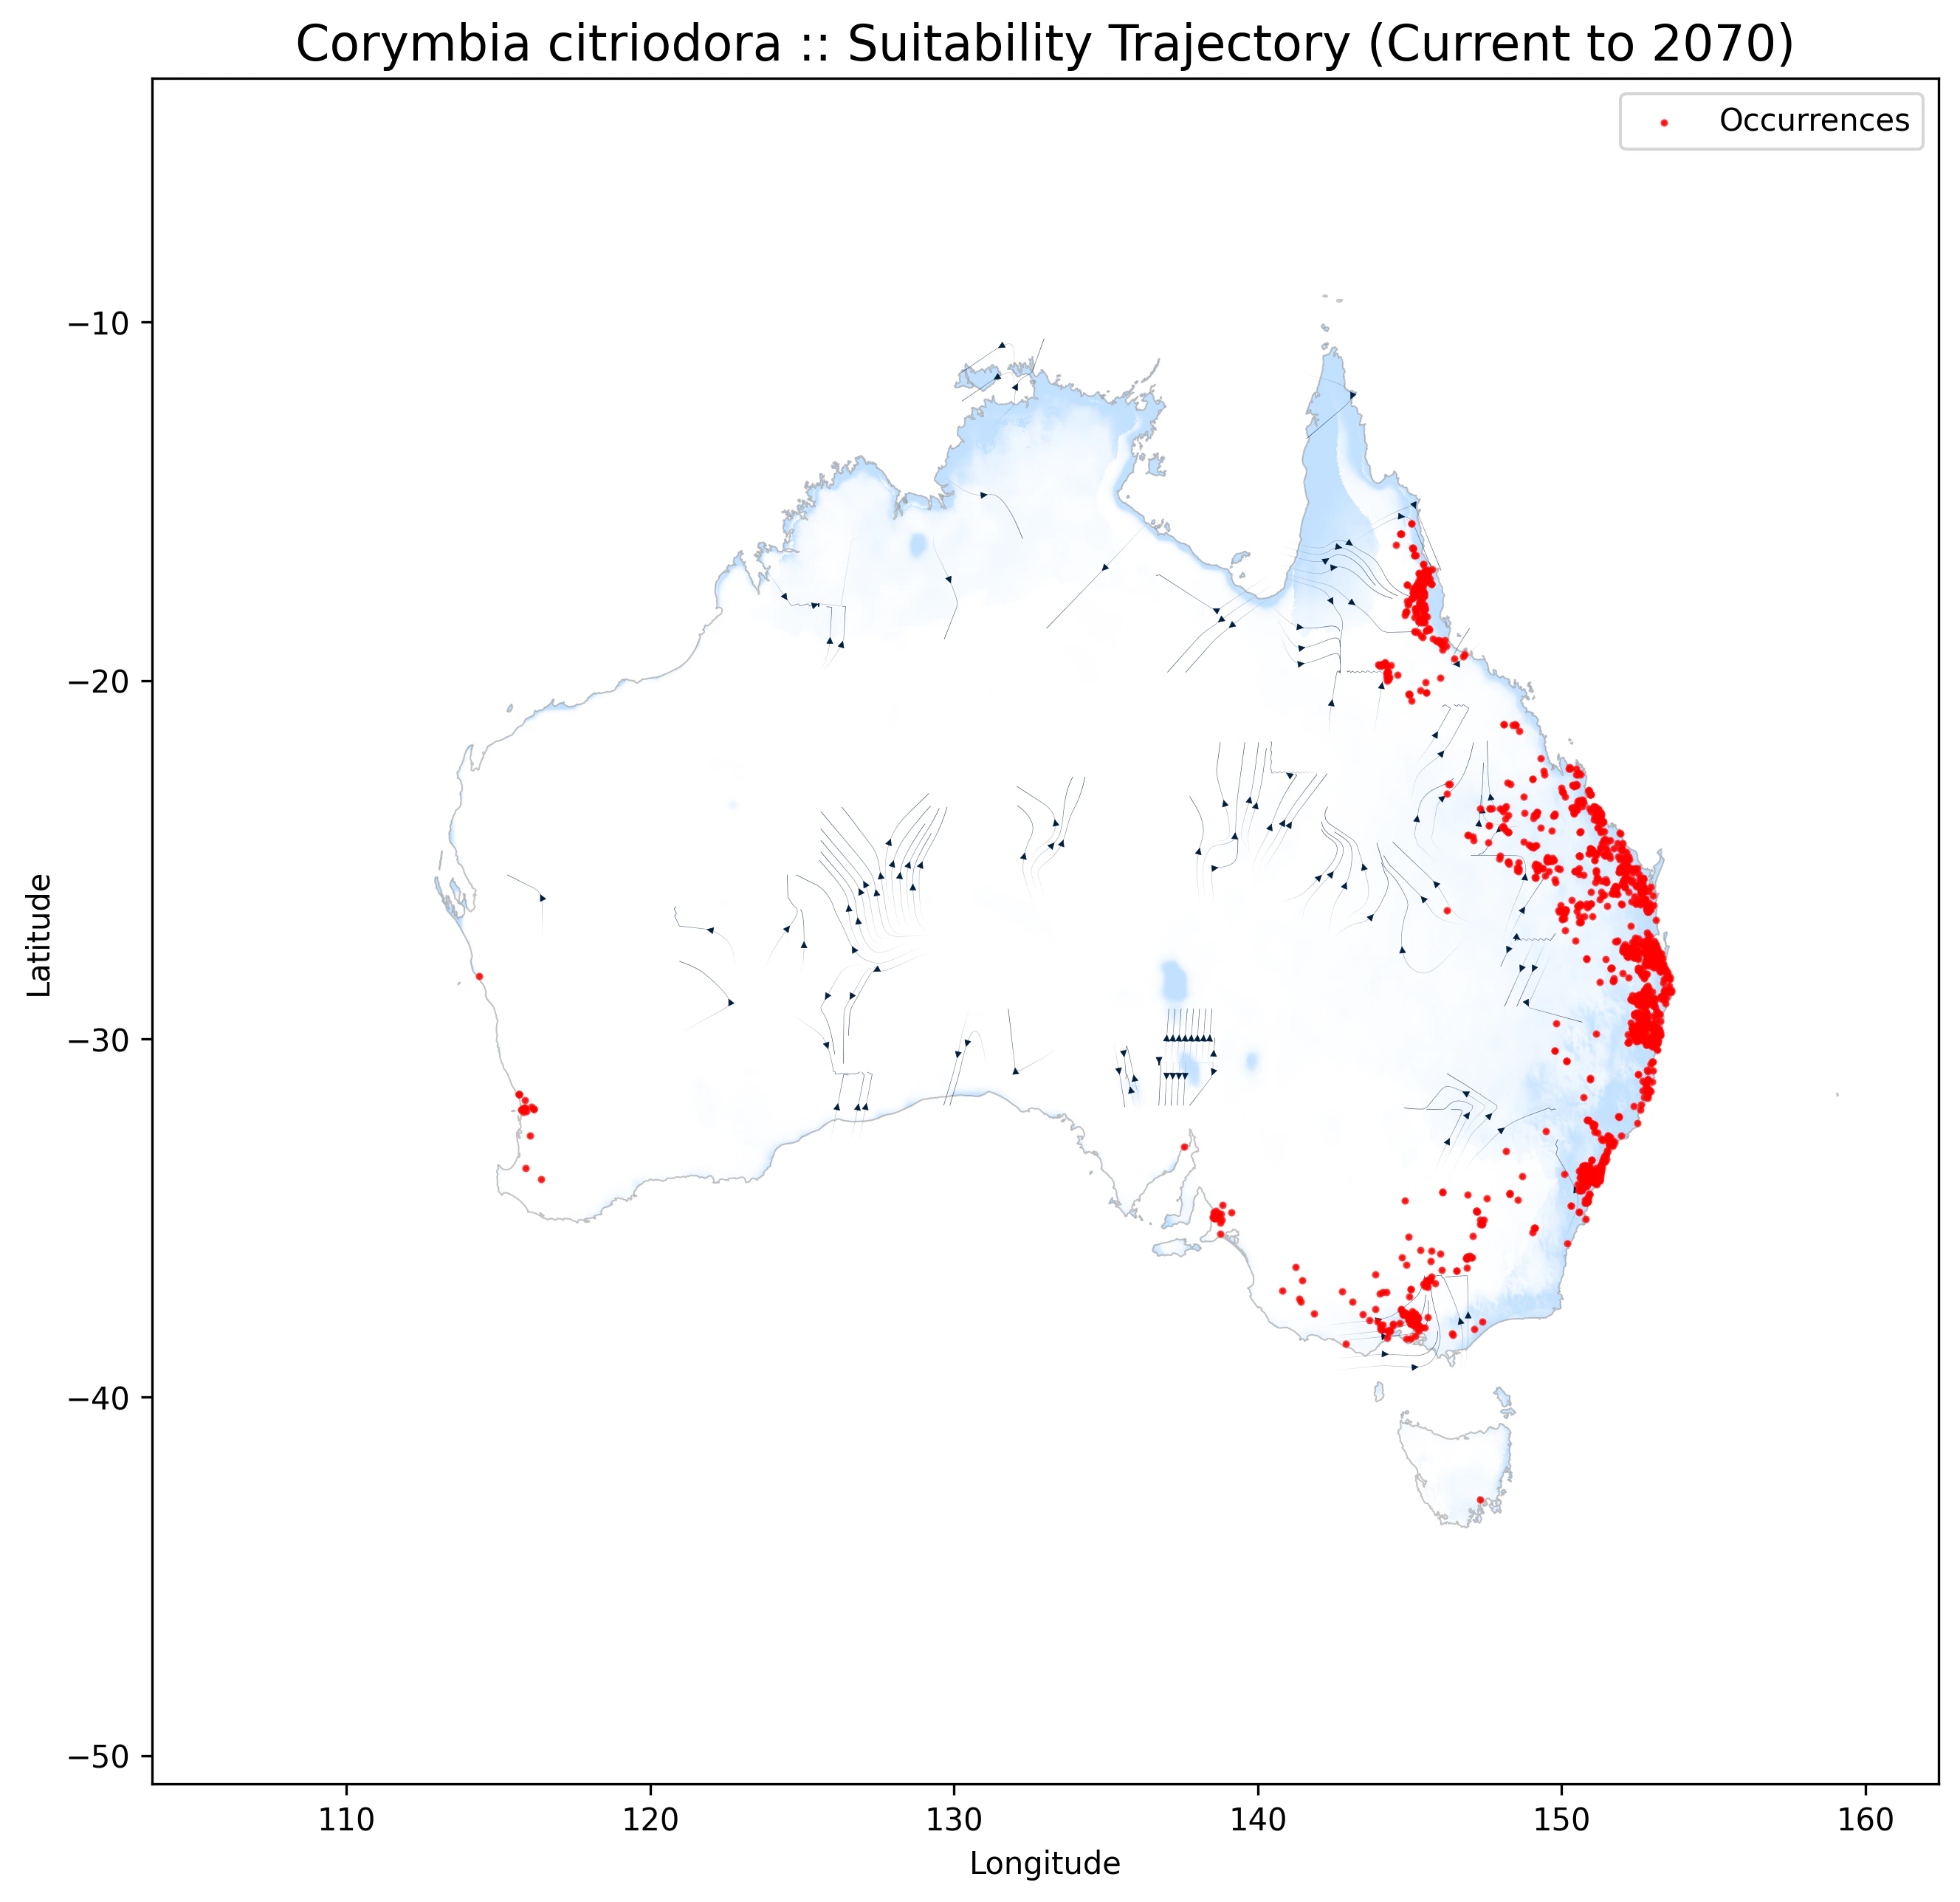
* `trajectory_streamplot` - Habitat shift trajectories
Error message if job failed
### Example response (completed)
```json theme={"theme":"github-dark"}
{
"job_id": "7fb88dc37627701681adae8932f85132",
"status": "completed",
"results": {
"change_plot": "/cache/7fb88dc37627701681adae8932f85132/suitability_change_2070.png",
"current_gradient": "/cache/7fb88dc37627701681adae8932f85132/current_suitability_gradient.png",
"future_gradient": "/cache/7fb88dc37627701681adae8932f85132/future_suitability_2070_gradient.png",
"trajectory_streamplot": "/cache/7fb88dc37627701681adae8932f85132/suitability_trajectory_2070.png"
},
"plots": {
"change_plot": "/v1/sdm/download/7fb88dc37627701681adae8932f85132/change_plot",
"current_gradient": "/v1/sdm/download/7fb88dc37627701681adae8932f85132/current_gradient",
"future_gradient": "/v1/sdm/download/7fb88dc37627701681adae8932f85132/future_gradient",
"trajectory_streamplot": "/v1/sdm/download/7fb88dc37627701681adae8932f85132/trajectory_streamplot"
}
}
```
***
## Download results
```http theme={"theme":"github-dark"}
GET /v1/sdm/download/{job_id}/{file_type}
```
Downloads the generated visualization files as PNG images.
### Available file types
* `change_plot` - Shows habitat gain, loss, and stability between current and future climates
* `current_gradient` - Current climate suitability map with gradient coloring
* `future_gradient` - Future climate suitability map for the specified period
* `trajectory_streamplot` - Streamlines showing how suitable habitat areas shift over time
## Example outputs
### Suitability change map
 ### Current climate gradient
 ### Future climate gradient
 ### Trajectory streamplot
 ### Example
```bash theme={"theme":"github-dark"}
# Download the trajectory streamplot
curl -X GET 'https://api.superseeded.ai/v1/sdm/download/7fb88dc37627701681adae8932f85132/trajectory_streamplot' \
-H 'X-API-Key: YOUR_API_KEY' \
-o trajectory.png
```
***
## Implementation details
The SDM service uses:
* MaxEnt modeling for species distribution predictions
* CHELSA v2.1 climate data (1km resolution)
* GBIF species occurrence records
* Cloud compute infrastructure (16GB RAM per job)
* Persistent caching for climate data files
* Maximum 10 concurrent SDM jobs per API key
* Each job has a 1-hour timeout
* Results are cached for 7 days
SDM generation requests are billable events. Each successful job submission counts as one API call for billing purposes.
### Example
```bash theme={"theme":"github-dark"}
# Download the trajectory streamplot
curl -X GET 'https://api.superseeded.ai/v1/sdm/download/7fb88dc37627701681adae8932f85132/trajectory_streamplot' \
-H 'X-API-Key: YOUR_API_KEY' \
-o trajectory.png
```
***
## Implementation details
The SDM service uses:
* MaxEnt modeling for species distribution predictions
* CHELSA v2.1 climate data (1km resolution)
* GBIF species occurrence records
* Cloud compute infrastructure (16GB RAM per job)
* Persistent caching for climate data files
* Maximum 10 concurrent SDM jobs per API key
* Each job has a 1-hour timeout
* Results are cached for 7 days
SDM generation requests are billable events. Each successful job submission counts as one API call for billing purposes.